A Smart Guide to Reach Out to the Best Web Analytic Tool
Best Web Analytics Tools Review
Imagine a train running on a rail track without showing any indicators such as fuel used, distance covered, and engine temperature. Similarly, visualize an airplane in the sky moving towards the east without showing the engine’s temperature, speed, working status of the engines, and remaining fuel amount on the control board in the pilot’s cockpit. In both the situations, the driver or pilot does not know what is actually happening or how the train or plane is actually working.
Do you think such a lack of awareness can make the driver or pilot reach up to the intended destination safely and efficiently? Practically, the answer is ‘No’. Well, such an incidence can also happen with your online business site in case you do not know what is exactly happening on it once it goes online. To know what is happening at your site is nothing but analyzing it.
Questions That Inspire You to Analyze
Let us consider a real-life scenario of your business wherein you are a cloth boutique firm and I am an individual looking for some official as well as casual stuff from brands only, due to bad experience of using unbranded shirts and pants in the past. Now, I only need to look at branded items and I reach on your site through my friend’s recommendation.
Like me, there will be many more people out there who will be interested in your online store. So, how do ensure your brand awareness and popularity online? Well, this is ensured only if you find answers to the following queries, and improve them for brand popularity in case they are dissatisfactory:
- What is the site’s rank on the search engines result pages?
- How many visitors are landing at your site each day?
- How many new visitors are finding your site each day?
- Which pages are the visitors hitting the most?
- Which pages are encouraging purchase?
- Which products do the visitors love more?
- Is the Web site design effecting in keeping visitors for long on a page?
- From how many different sources does the traffic (visitors) come from?
Well, these queries are like indicators that show you what is happening on your site. They measure the performance of your site in the most relevant niche and give you a report of how successful or improvable the performance is! If you are not keen on doing this yourself, services like the Commence sales tracking and reporting services are available for hire. It’s best to leave it to the experts if you are not inclined yourself and there’s no shame in that.
Think a Minute
Do you think without the above answers, your online site can ever fulfill your business goals? If you do not track or monitor, it is like leaving the train (site) at its own speed (capabilities), which can get de-railed any time (lost online visibility or rank). After all, you should know where you are standing (site rank) to move further to the target!
Easiest Method that Encourage You to Analyze
Well, this is none other than the Web analytics tools! You can obtain quick answers to all the above questions by using a Web analytics tool. With a simple yet powerful design for notifying you about the site’s performance, these tools aid in tracking different statistics. Through these statistics, you can see the number of people viewing each page, sources from where they came from, and the number of site features that are most popular.
The Web analytic tools track key metrics of your site to measure traffic and Click-Through Rates (CTRs) for new page or content as well as comprehend your visitors’ requirements and behavior. These measurements tell you whether your site needs improvement or not!
Quick Aid
If the absence of above statistics keeps you awake even at night, you are truly eligible for getting a Web analytics tool.
Before I take you on a quick tour of some most important tools in the World of Web Analytics 2.0, let us find out the metrics that you got to measure with them.
Metrics (Data Indicators) That You Should Analyze
Think a Minute:
Do you think it makes sense to look for a tool when there is no idea of what information needs to be tracked? Well, the information that should be tracked can vary from simple visitors count to complex analysis of visitors’ behavior. Therefore, the question can arise as to which vital metrics should be paid attention to while analyzing the site through a tool. Here is a simple breakup of vital metrics:
Category 1: Primarily, you will have to know how many people are visiting your site. While this one seems easy to find, it is actually not. Metrics answering this query include:
- Unique Visitors: Shows the total number of visitors on the site during a set period. It does not include repeated visitors. This statistic reveals how effective your marketing efforts are in reaching a wider audience.
- Repeat Visitors: Shows the number of visitors coming back to your website multiple times. It indicates how big is your loyal fan base!
- Visits: Shows the number of visitors to a specific page or site. The trend in the number of visits over time shows you insight into your brand’s popularity. When you compare with the number of visits to each page, it shows which parts of your site are useful.
- Page Views: Shows the number of times a visitor views a specific page. Increased page views simply denote that your site is becoming more engaging.
Category 2: You will now be interested in who these visitors are and what they are doing on your site when they visit. This helps in knowing which site pages or features attract them the most and which ones go unattended. Metrics in this category include:
- Visitor Information: Includes region or country, Web browser in use, and more details about the visitors.
- Registered Users: This shows what each logged-in user did on your site in case your portal requires visitors to log in. This facilitates a more detailed understanding of what diverse visitors are doing on your portal.
- Bounce Rate: This shows the percentage of visits during which a visitor left your portal after looking at just one page. This statistic reflects visit quality. For instance, a high bounce rate for a blog is not a point of worrying because reading one article and leaving the site is sensible. However, for an eCommerce site, it is a point of worry because it indicates that the entrance pages are either non-attractive or irrelevant to the visitors.
- Click Path: This shows how the visitors navigate across your site. Also known as click tracks, these visual representations show the visitors’ journeys. For example, a click path can reveal that 10% of home page visitors prefer clicking the Resources link, while 50% clicks on Current Offers, 25% go on the About Us page, and 20% leave the site.
- Conversion: Tracks the number of people responding to your CTAs (Call to Actions) or doing what you want them to do. For example, it can show the number of users who clicked on a Newsletter link to subscribe to it or on Free Offer on the home page and went ahead to grab it. This metric is somewhat complex as it needs to be set in a tool but is truly a valuable one.
- Top Entry and Exit Pages: Shows the pages through which most visitors tend to enter and leave the site. It is unwise to assume that the home page is always the entry page.
- Site Search: Shows what people search on the site in case the analytic tool supports it. The metric helps you comprehend what visitors want from your site.
Category 3: Next, you would surely like to know from where the visitors are coming to your site. Knowing this information can help in better comprehending the types of sources that move people to your site. Metrics include:
- Organic Traffic Sources: Show the percentage of people who come to your site by clicking its organic listings on the search engine results page. If the percentage is below 40%, it simply means to revamp your content.
- Search Keyword: Shows the words or phrases that the visitors typed in the search box of search engines such as Google to reach to your site. This helps in determining the effectiveness, competitiveness, and success of keywords. It is wise monitoring your keywords for ensuring that you reach out to your target audience.
- Inbound Links: Shows the number of links to your site coming from other sites. Many tools also show which of these links get people to your site. This metric provides an insight as to how effective is your link building strategy and what types of sites consider your content useful. The rule is that the higher the other site’s domain authority, the more valuable is the link.
While the aforementioned metrics should be adequate to get started, many robust analytics tools come with even more sophisticated metrics and analysis features. In fact, many people earn their livelihood by analyzing these statistics, who are typically professionals hired for a profound analysis for big sites.
When considering the diverse analytical tools for your business, the assortment of options can lead to confusion, as you might not know how to use them. This is why it is recommended hiring a professional to dig the virtual space of your site and generate all vital reports.
I just cannot go ahead without stating about a golden rule existing in this regard. It is known as the 90/10 rule, which means if you are spending $100 on analytics for making new decisions for your site, it makes sense to invest $10 on the analytical tools and $90 on analysts with great expertise. Without a proper understanding of the details given by the tools, the reports remain as raw data (no processing), which is of no use for your business.
Bryan Eisenberg, who is the marketing consultant affirms that investing in tools and people who require the former to be successful is the key. However, what matters is the people comprehending that data. According to Avinash Kaushik who is the author of Web Analytics: An Hour a Day, “The quest for a tool that can answer all your questions will ensure that your business will get scrapped and that your career (Web Chief Marketing Officer and Analysts) will be short-lived.” Therefore, he suggested focusing on ‘multiplicity’, the use of multiple tools for different purposes.
In addition, it is worth keeping in mind that neither all tools have the same number of metrics nor do they work in the same way. Because of the high level of complexity involved in the world of analytics due to unique site’s characteristics and visitors’ varying background of preferences, each tool is designed to deal with the metrics in a different way. This is perhaps why Mr. Kaushik focuses on using multiple tools. Using multiple tools simply deepens your level of insight into the site’s success rate as well as a customer base.
Identifying the web actions as those of a ‘unique visitor’ is complex as well as subjective. Therefore, several tools tend to compute these statistics differently. For example, a few tools consider traffic as per a log of the pages on offer by the Web server, while some depends on the reports provided by cookies (information packs sent by the browser of each user). Therefore, while using different tools, it is common to have different values for the same metrics.
For big businesses, tools that are more robust can really be useful, although at a handsome cost, but for small and mid-sized businesses, cheaper and even free tools are available for getting the desired control over the site statistics. Obviously, you will not use all the available tools all the time but employing a few is simply the need of the hour as well as a vital part of your overall web strategy.
Think a Minute
It is now clear no single tool can be the best for analyzing the site. Then, how do you determine the most suitable suite of tools for analytics?
Recall Web Analytics 2.0
According to Mr. Kaushik, Web Analytics 2.0 is defined as the analysis of quantitative and qualitative data from the site and competition for driving a constant improvement of the online experience of customers and prospects, translating to your set outcomes (online and offline).
Rather than only a data analysis process, Web analytics 2.0 is an ongoing process of three-tiered data analysis and delivery service for all types of businesses. First is the data itself, as it reveals the clicks, page views, traffic, and more for both the site and direct competition. Second comes what is done with that data, or how you process the gathered information from Web Analytics and apply it to both existing and new customers for ensuring a meaningful and better experience.
The last tier involves how the aforementioned actions are aligned with the most vital business objectives (both online and offline), such as sales, social presence, customer engagements. In short, herein, the data itself facilitates watching how your site is performing.
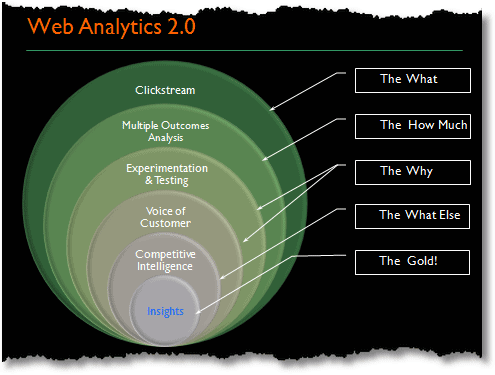
Based on these tiers, Mr. Kaushik has also come up with an acceptable order of key components of Web Analytics, which are:
- Clickstream: Measures ‘What’
- Multiple Outcome Analysis: Measures ‘How Much’
- Experimentation and Testing: Measures ‘Why’
- Voice of Customer: Measures ‘Why’ just as the third component
- Competitive Intelligence: Measures ‘What Else’
- Insights: Gives ‘Gold!’
Making your site reach the desired performance levels is simply not easy. It takes persistent tracking as well as frequent measurement of diverse metrics for optimizing usage. This is exactly where the concept of Analytics is implemented by using tools belonging to its different component levels. This is how you ‘multiplicity’ is used – employing the most suitable tool at each component stage. Let us now look at the most reliable and efficient Web Analytics tools available per component.
Clickstream Analysis Tools
Clickstream measures data for each page visited, including details such as how the visitor came on that page (keywords, social media support taken, and ads), how long the visitor was on that page or site, and what the visitor did (purchased, subscribed to an offer).
Google Analytics (Free, Ideal for all Businesses)
This one is among the most robust, simpler, and profound analyzers in the market and creates detailed statistics about visitors. You can find out the sources that bring your visitors to your site, their actions on the site, and their frequency of coming back. You can even find their demographics such as geographical location and interests, number of daily visits, number of currently active visitors, and daily revenue generated by the site. Because it is integrated with Adwords that is largest paid search platform online, Internet marketers can ideally monitor the landing page activity and employ the necessary improvements.
For small business owners, it is perhaps the only comprehensive as well as easiest tool to rely upon.
Pros: Ease to set up and use, support for mobile sites, goal tracking, custom data gathering and reports, fast report generation, PDF reports download, quick sharing of dashboard, good help to get started, multiple dashboards support, world-class analytical tools
Cons: No brand-matching customization (limited fonts and layouts), less metrics (widgets) per dashboard, requires constant training, limited goals, Premium version costlier although advanced
Piwik (Free for Hosting on Your Web Server)
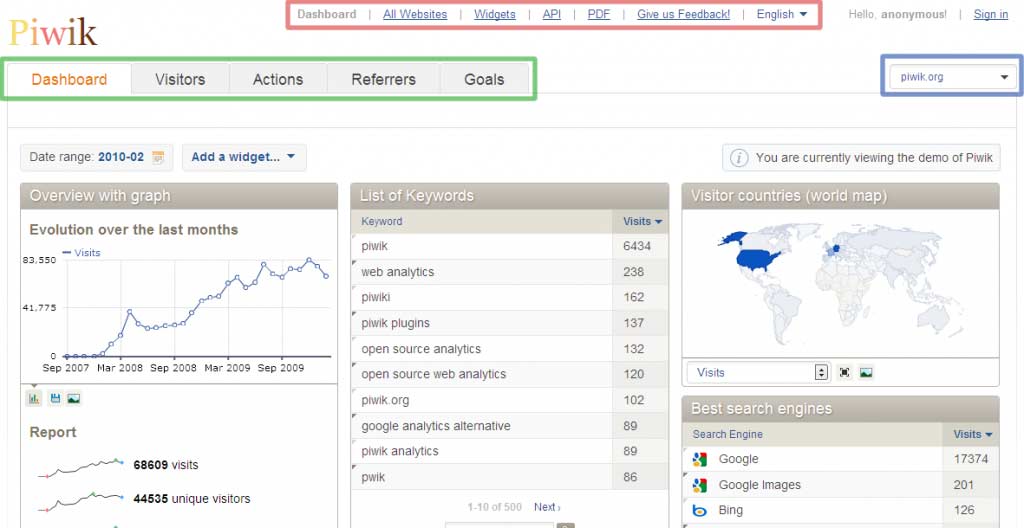
Go for this one in case you a technically oriented person and loves adventures. Piwik is an open-source tool executing on MYSQL and PHP. It is perhaps the leading open source tool providing valuable insights into the market campaigns, visitors, and more for optimizing the existing strategy for ensuring the best online experience of your visitors. The tool is designed as an open source alternative to Google Analytics.
For those who do not like sharing all data with Google, Piwik is an ideal substitute.
Pros: Privacy as data on your server is not shared, customizable interface, real time reports, security ensured by blocking URLs and traffic, tracking ability for multiple sites, several data export formats supported, Android and iOS app, no limit on data storage like Google Analytics, all Google Analytics features included, exhaustive help files
Cons: A bit of time-consuming installation process
Woopra (Free For Up to 30,000 Actions per Month after which it is Chargeable (Many Packs)
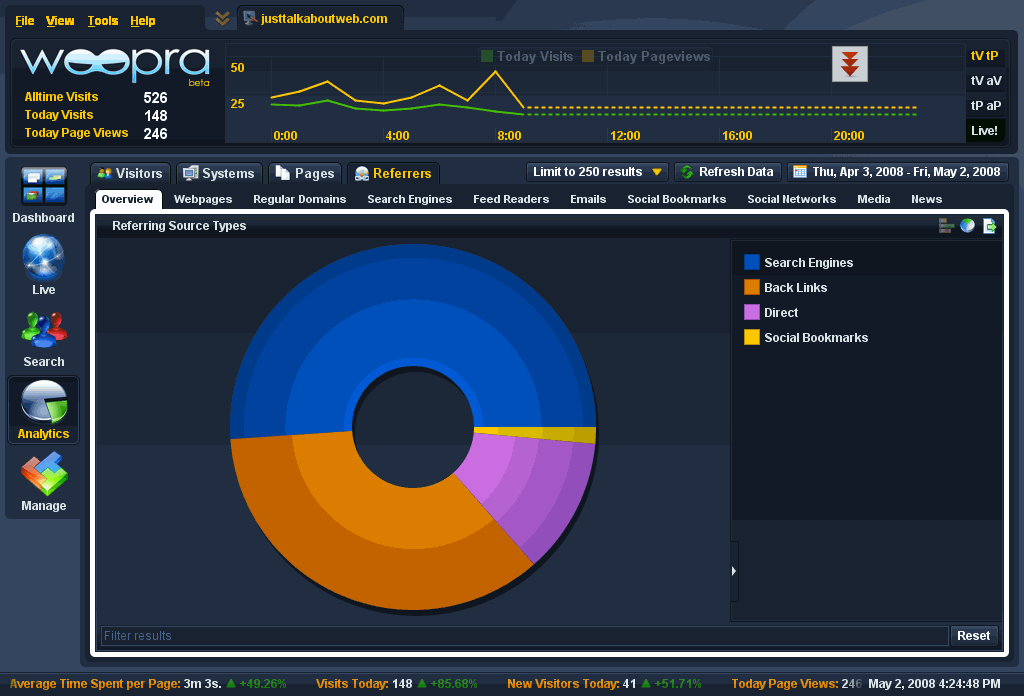
Woopra is another top-notch tool providing real time tracking of multiple sites for improving customer engagement. It wins over Google Analytics only in terms of update in which the latter takes more time. The desktop tool shows live visitor stats, including location, pages on which they are on, and pages or sections that they have been visited.
I recommend the tool especially for e-commerce site owners who get a chance to chat live with their visitors.
Pros: Well-organized interface, real time viewing, possible customer insights revealed, mobile app supported, notifications for important customer activities, customization of customer data, behavioral profiles for each customer by watching what they did on the website.
Cons: Confusing for beginners due to much data on the dashboard.
You can extend your control and above tools’ power by using Google or Bing Webmaster Tools. These tools help obtaining SEO details and major diagnostic data about your site. It is also recommended using Feedburner for tracking the activity of Clickstream occurring within the RSS feed.
Multiple Outcome Analysis
The outcome analysis is likely to happen within the tools mentioned above and below this section. For instance, you shall be configuring goals and ecommerce tracking in Piwik or Google Analytics. Similarly, campaign’s profit and margin are computable in Microsoft Excel through a relevant database query. Therefore, no specific suggestion of tools for this component.
Experimentation and Testing Tools
These tools aim at improving user experience and increasing the chances for having conversions (leads). At this stage, you should consider conducting different tests such as clickmaps, heatmaps, multivariate (MVT) testing, A/B testing (multiple versions of a site executing simultaneously), geotargeting, and so on. Because there are many tools, I will be covering them briefly.
- Google Website Optimizer (Free): It is a powerful A/B and Multivariate (MVT) testing solution that rotates varying content segments to see which sections get the most clicks. You can choose different page sections for testing such as images and headline.
- Optimizely: It is for those who wish to test very fast, especially A/B testing. It is a new but simply tool offering powerful results for improving the site performance without having any kind of technical knowledge.
- Crazy Egg: This tool employs the Heatmap technology to offer a visual picture of what visitors are doing on pages, where they are moving their mouse, where they are scrolling, and where they click. Such tracking allows observing the most attractive sections of pages and improving the ignored sections for optimizing user interaction. You can also split the data to see how visitors from a single traffic source behaved in comparison with those from other sources.
- MouseFlow: This tool records what the visitors do on your site, right from moving a mouse to filling a text box. It helps in tracking the visitors’ behavior and comfort level through heat maps as well. Mouseflow combines Crazy Egg and UserTesting features.
- UserTesting: This one employs a distinct way to test your site: get real time feedback from visitors in the chosen demographic. You pay for participants chosen to answer your questionnaire regarding your site. A video with the user and her or his activity is recorded and you get the feedback in an hour, stating the user’s actual thoughts. The tool is costly, but worth for real time instant feedback.
Voice of Customer Tools
Clickstream data provides insights into what the visitors did on the site, but it does not say why they left the site without staying there for long. Well, this needs visitor research that can be done by the below described tools.
- Kissinsights (Kissmetrics – Free to Paid): It helps in real-time customer acquisition and retention by revealing information on user habits and engagement before and after they use your It is easy to install and use, as it asks all queries to customers via a simple dashboard for getting customized feedback in the form of short comments. Its data funnel points to the weakest point/step blocking conversions, while the revenue tracking features show what customers do after purchases. In short, you get all data required for increasing conversion rates.
- 4Q (iPerceptions – Free): This is a pure online survey tool allowing you to comprehend the ‘Why’ aspect of visitors. Surveys facilitate gaining vital insights from the customer real experiences. It answers questions such as how satisfied are the customers, what they do at the site, are they doing what they need to do, and so on.
- Qualaroo: This is also a real-time survey tool for getting feedback from the users currently on the site. However, it stands apart because it allows you to use any combination of variables. For example, it helps asking shopping experience when the visitor fills the shopping cart and usage experience while leaving the site. You can get both entry and exit reviews. Consider this tool for sites with a high turnover of visitors and site owners who need to know ‘why’.
- Clicktale (Free to Paid): This one is most prominent in the customer experience analytics, which aims to optimize usability as well as maximize conversion rates. The most useful features are session playback and visitor recordings, which enable watching everything any visitor does on the site. You get to see the recordings of each action of a visitor, right from the first to the last click. The tool also comes with scroll maps, heatmaps, and visual conversion funnels for gaining more useful details about visitors and their habits. However, it is a costly choice.
Competitive Intelligence
Existing since the invent of business, competitive intelligence includes knowing what the competitors are doing, which can be then done better and faster. Such data enable you to recognize what is known and what is unknown as well as analyze ecosystem trends, failures, weaknesses, opportunities, and rising customer preferences. This details help in planning better marketing programs.
- Google Trends & Google Insights (Free): Both tools for search are now merged into a single tool. The Trends tool offers worldwide visitor data for sites deployed anywhere in the world and makes it easy to comprehend traffic and search keywords. The Insights tool simply points out to the global database of customer intentions; you can know what your customers are thinking and feeling. You can use this tool for analyzing industries, emerging trends, share of search, and offline marketing strategies as well.
- Google AdWords Keyword Tool (Free): Consider this tool for refining your SEO strategy as per the most searched keywords, download specific user-typed queries, and gaining insights into specific brands under analysis.
- Facebook Insights (Free): Track the popularity on Facebook by tracking follower counts, post comments, and likes through this tool based on users and interactions. It helps in improving customer engagement on the biggest social media platform.
- Twitalyzer (Free): This one offers detailed dashboard with several metrics for measuring Twitter influence and engagement on your brand identity. You can track your account’s impact on followers, retweet level, and level of conversation engagement. It is easiest one to use for your Twitter account.
- Klout: Consider this one for having the cleanest metrics for measuring performance on Facebook and Twitter.
Conclusion
With Web Analytics tools, the modern responsibility of improvement has been given to us. With so many tools available, it is not difficult to improve your online visibility as well as performance. However, the need is to choose a few of the above tools to collect all the data and process it for taking the right decision. Although Google Analytics is still the most famous tool out there, it is better to use it in combination with other tools to push your site to its maximum potential.
In case of no tight budget and customization as a top priority, it is recommended to select the paid tools that offer all the features and metrics for improving the site’ performance and expand the online customer base.


